Page content
Background
Conventional letters work well as targets to measure errors of refraction since they are particularly vulnerable to the effects of spurious resolution caused by optical defocus as a result of phase reversals within their rich spatial frequency spectra, resulting in the letter quickly becoming harder to resolve with decreasing angular size. However, these letters appear to be much less sensitive in indicating visual loss as a result of neural processes in early and intermediate AMD, with studies reporting a decrease in VA of only two or fewer letters in patients displaying early AMD lesions. It seems that only a weak relationship exists between the severity of retinal changes and VA, influenced by the location and extent of the lesion in addition to the pathology stage. Traditional VA tests provide an indication of the highest spatial frequency that can be resolved by the visual system at high contrast.
It is important to be able to assess visual function that is specifically sensitive to the neural changes in AMD whilst also displaying good repeatability. Additionally, the test must be easily understood by patients and be simply and quickly administrable in routine clinical settings.
In an attempt to investigate and address this problem, our team at Moorfields Eye Hospital and Ulster University has designed a pseudo high-pass letter VA chart which is more sensitive to the early signs of AMD. Addressing a high priority for research as identified by the 2013 Sight Loss and Vision Priority Setting Partnership, the project was funded by Fight for Sight and the Special Trustees of Moorfields Eye Hospital NHS Foundation Trust.
Design of the Moorfields Acuity Chart
Howland et al. [1] described letter stimuli in which large inter-letter legibility differences are effectively overcome by removing the low spatial frequencies. These high-pass filtered letters, each made up of a black core and white surround are presented on a grey background, the luminance of which is equivalent to the mean luminance of the letter. As the letter reduces in size to the threshold acuity level, the high spatial frequencies beyond the resolution limit of the retina are filtered by the optics of the eye. The result is that, under normal foveal viewing conditions, the detection and recognition thresholds are the same such that, when a letter can no longer be recognised, it cannot be detected either, hence their designation as ‘vanishing optotypes’. Conventional letters do not behave in the same way since their luminance difference to the background results in separate values for the detection and recognition thresholds. Under peripheral viewing conditions, however, the two thresholds for vanishing optotypes also separate and previous studies have confirmed that resolution of these stimuli is determined by neural sampling density rather than optics [2,3]. Employing these stimuli instead of conventional black-on-white letters in a VA test may allow for better sensitivity to the neural changes associated with AMD. Furthermore, initial studies with these letters demonstrated that VA measured with these letters displayed lower variability [4,5] whilst also demonstrating a greater robustness to the effects of optical defocus in normal subjects [6].
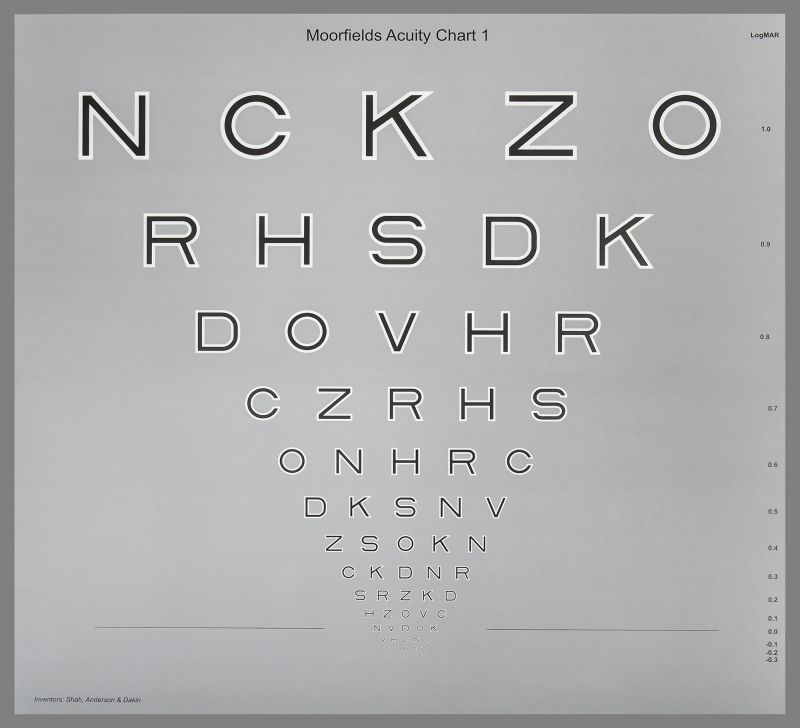
In order to investigate their usefulness in a clinical acuity test several preliminary studies of the five-year project led to the eventual design of the Moorfields Acuity Chart (MAC). This chart is based on the gold standard layout of the ETDRS chart with five letters per line in 0.10 logMAR steps, but replacing the conventional letter design with the high- pass filtered letters (see Figure).
A 2016 study by our group [7] found that the MAC is able to detect functional loss owing to AMD at levels where conventional acuity remains relatively unaffected, particularly in its earlier stages. However, whilst the MAC may result in a stronger disease signal, this is of little value if it is lost in the test variability. TRV was found to be similar for both charts in both the normal and AMD groups, ranging from +/-0.09 to +/-0.12 logMAR.
Simulations suggest that, as photoreceptors ‘drop out’ as AMD develops, resolution of the high-pass filtered letters on the MAC chart suffers more from the effects of neural under-sampling than
it does for conventional letters. For conventional letters, a larger proportion of photoreceptors must become dysfunctional before the loss causes resolution to fail compared to vanishing optotypes in AMD. As the fovea becomes more involved, recognition of both charts suffers in a more equal fashion and the difference in acuity loss between the two charts becomes smaller. In other words, with conventional letters which contain a range of spatial frequencies, the visual system is able to shift to using the lower spatial frequencies and these are more robust to undersampling. With the MAC chart, acuity is affected sooner with undersampling since the only available higher spatial frequencies can no longer be resolved and the letter quickly becomes unidentifiable.

Patient benefit
With the projected number of people with AMD worldwide predicted to be 196 million by 2020 [8] and with an increasing number of treatments becoming available, the ability to detect AMD earlier is absolutely vital. Whilst other tests of visual function in AMD exist, high contrast VA measurements remain the only internationally accepted endpoint for clinical trials. Results with the MAC test thus far suggest that it may be an effective tool with which to achieve this, whilst also being simple to administer routinely in a clinic environment and easily understood by patients. The chart is currently being used in a variety of clinical trial across the world.
Where can I buy the Moorfields Acuity Chart?
The Moorfields Acuity Chart is produced and distributed in the UK by Peter Allen Vision www.pavisionuk.com
References
1. Howland B, Ginsburg A, Campbell F. High-pass spatial frequency letters as clinical optotypes. Vision research 1978;18(8):1063-6.
2. Anderson RS, Ennis FA. Foveal and peripheral 7. thresholds for detection and resolution of vanishing optotype tumbling E’s. Vision research 1999;39(25):4141-4.
3. Demirel S, Anderson RS, Dakin SC, Thibos LN. 8. Detection and resolution of vanishing optotype letters in central and peripheral vision. Vision Research 2012;59:9-16.
4. Shah N, Dakin SC, Redmond T, Anderson RS. Vanishing Optotype acuity: repeatability and effect of the number of alternatives. Ophthal Physl Opt 2011;31(1):17-22.
5. Shah N, Dakin SC, Whitaker HL, Anderson RS. Effect of scoring and termination rules on test-retest variability of a novel high-pass letter acuity chart. Invest Ophthalmol Vis Sci 2014;55(3):1386-92.
6. Shah N, Dakin SC, Anderson RS. Effect of optical defocus on detection and recognition of vanishing optotype letters in the fovea and periphery. Invest Ophthalmol Vis Sci 2012;53(11):7063-70.
7. Shah N, Dakin SC, Dobinson S, et al. Visual acuity loss in patients with age-related macular degeneration measured using a novel high-pass letter chart. Brit J Ophthalmol 2016 [Epub ahead of print].
8. Wong WL, Su X, Li X, et al. Global prevalence of age-related macular degeneration and disease burden projection for 2020 and 2040: a systematic review and meta-analysis. The Lancet Global Health 2014;2(2):e106-e16.