
Visual Acuity
Visual acuity is the term used to describe the smallest detail a person can see when looking straight at a stationary, high contrast (e.g. black on white) target in good lighting.
Things that matter about visual acuity;
- How big the object is
- How far away the object is
- How many other things are close to the object
When a child has reduced vision: Practical factsheets for close work
The following are one-page factsheets containing practical recommendations for close work for three levels of visual acuity. They are general guidelines, but hopefully give useful advice to help understand visual needs. Please click on the appropriate visual acuity level below.


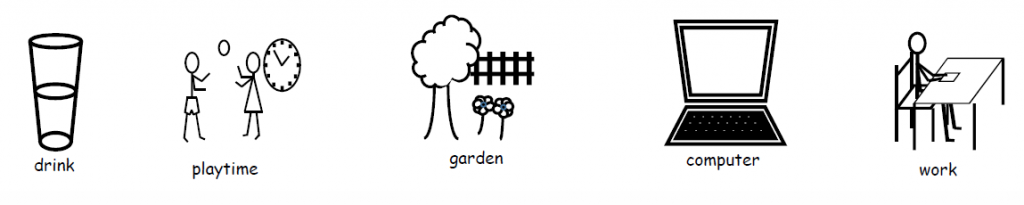
Picture exchange communication systems (PECS) are commonly used in school with children
For someone with ‘good’ or average visual acuity, such as 0.0logMAR or 6/6 Snellen, smaller objects will be easily seen, such as conventional print and pictures in a book.
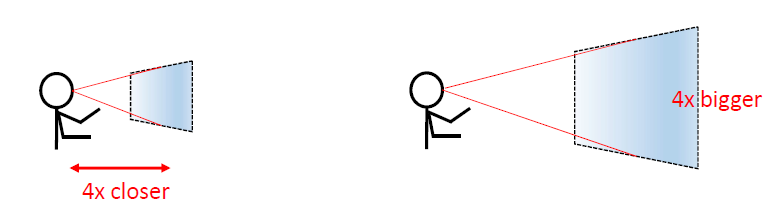
For someone with reduced vision, making the object bigger or getting closer will help. e.g. for 6/24 vision (0.6logMAR) make the object 4x bigger or bring it 4x closer
Visual information, especially when a child has reduced vision, should be:


Printable examples
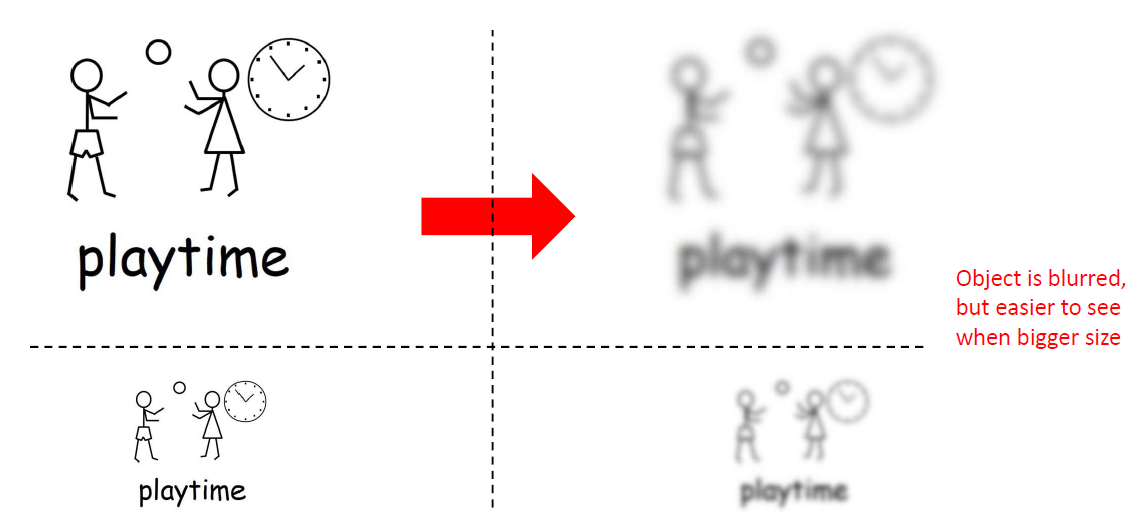
The images in these pages can be used to give an indication of the detail and size of an image a child with a given visual acuity should be able to see.
It is tiring and frustrating to work with images that are only ‘just visible’ so we advise that children work with images that are at least twice their visual acuity.
You may have Visual Acuity measures for the right eye and left eye separately (monocular) or together (binocular). Generally it is the eye with the best acuity (smallest number at the bottom of the fraction if written in Snellen convention) or the binocular acuity that should be used to decide on suitable image sizes.
To find out what size of image should be seen easily at different distances click on the visual acuity below which matches or approximates to the one you have been given. Picture and letter images are available. Choose the image that is most appropriate for the inpidual.
For each acuity level several pages of images are presented. The text at the top of the page details whether these images are the minimum size that is likely to be seen or a size that should be easily seen.
Please click on relative links for the Snellen/logMAR numbers below to obtain Picture and Letter downloads.
Before printing images representing different acuities please print THIS page and check the scale for gross distortion. The scale on this page has been provided as a check for distortion of images during downloading. When the box is printed it should be 80mm by 80mm (8cm by 8cm).
These images are made available with permission from Kay Pictures Ltd and may only be used as described on this website.
Measuring visual acuity
Visual acuity is often measured by the Optometrist, Optician, Orthoptist or Ophthalmologist by asking the patient to read progressively smaller letters presented on a wall chart six metres (20 feet) away.
Recognition Acuity
Children may be asked to identify letters or pictures either by naming or matching them with a key card. Letter and picture tests measure recognition (or identification) acuity. The recognition (or identification) acuity of a person’s visual system refers to the smallest detail whose form can be recognised.
This type of acuity is measured by a standard letter chart.
The patient must recognise the letters and identify them correctly.
When the letters reach the limit of the person’s recognition acuity they are too small for the detail within them to be distinguished.
At this point, for example, an ’N’ may be indistinguishable from an ’H’. Younger patients or those with intellectual impairment can be asked to match letters or pictures to achieve a measure of recognition visual acuity.
The examiner usually holds the letter at three meters from the child.
Resolution Acuity
Young children or those with communication difficulties can be tested using methods that don’t require the patient to speak or point. Most commonly looking responses are assessed to estimate visual acuity. These tests measure resolution acuity.
The patient’s looking behaviour, i.e. do they look towards an object of visual interest, is interpreted to assess whether they can see targets made up of increasingly fine black and white lines. These tests are called preferential looking (PL) tests.
Resolution acuity tests only require the patient to look towards the black and white target. The patient doesn’t need to verbally communicate with the examiner or necessarily understand the test.
When vision is reduced and when there is disease present in the eye or the visual system resolution acuity tests may overestimate vision.
Measures of resolution acuity made with techniques such as preferential looking and the visual evoked potential should be interpreted with this in mind.
LogMAR/Snellen Conversion
Sometimes visual acuity is recorded in other notations e.g. logMAR or cycles per degree.
These other notations can (with care) be converted to a Snellen fraction for comparison. This web page will deal only with acuities recorded in Snellen fractions.
If acuity has been recorded using logMAR or cycles per degree the tables below can be used to approximate the Snellen fraction.
Also available in the tables is a conversion from metric (UK standard) to Imperial (US standard) recording.
NOTE: tests which use logMAR or cycles per degree to record acuity may not be measuring the same type of visual acuity as a Snellen test and conversions must be treated with caution.
| Snellen equivalent | LogMAR | Cycles per degree (cpd) |
|---|---|---|
| 6/12 (20/40) | 0.3 | 15.0 |
| 6/18 (20/60) | 0.5 | 10.0 |
| 6/24 (20/80) | 0.6 | 7.5 |
| 6/36 (20/120) | 0.8 | 5.0 |
| 6/48 (20/160) | 0.9 | 3.75 |
| 6/60 (20/200) | 1.0 | 3.0 |
| 6/72 (20/240) | 1.1 | 2.5 |
| 6/90 (20/300) | 1.2 | 2.0 |
| 6/120 (20/400) | 1.3 | 1.5 |
| 6/150 (20/500) | 1.4 | 1.2 |
| 6/180 (20/600) | 1.5 | 1.0 |
| 6/240 (20/800) | 1.6 | 0.75 |
| 6/360 (20/1200) | 1.8 | 0.50 |
| 6/480 (20/1600) | 1.9 | 0.28 |